

What is an ABC-analysis?
An ABC-analysis is a commonly used method to provide insight into the contribution that inventory and/or suppliers make to your business. The analysis ranks stock and suppliers in three categories: A, B or C. The foundation of the ABC-analysis is the 80/20 rule of the Italian economist Vilfredo Pareto and works like this: 80% of your business’ revenue is determined by 20% of the stock.
If we take revenue as a performance measure.
- The A category consists of the twenty percent of your stock that makes up about eighty percent of your revenue.
- Category B consists of thirty percent of your stock and generates about fifteen percent of your revenue.
- Category C consists of fifty percent of your stock and represents about five percent of your revenue.
The Pareto principle not only shows how many products you sell but also provides insight into what these products contribute to the gross revenue of your business.
Why an ABC-analysis in inventory management?
The ABC-analysis is a method to not only improve your stock management, but it also makes your warehouse distribution more efficient.
Avoid high inventory holding costs
Which products do you leave on backorder with your supplier, and which products do you want to keep physically in your warehouse? Reduce obsolete stock - products that have little or no influence on your revenue - and avoid high inventory holding costs that can negatively affect your cash flow. The ABC-analysis shows which products cost you the most and what these same products yield.
Insight into the contribution of suppliers
Furthermore, the analysis shows which suppliers make the largest contribution to your revenue. This information allows you to make better agreements about prices, credit and deliveries. When you take into account that approximately 80% of your revenue comes from category A products, then it is important to purchase this part of your inventory for the right price and maintain the stock level to avoid lost sales. When you cannot meet customer demand, that will harm your service levels, and loss of revenue can be the result.
How to perform an ABC-analysis?
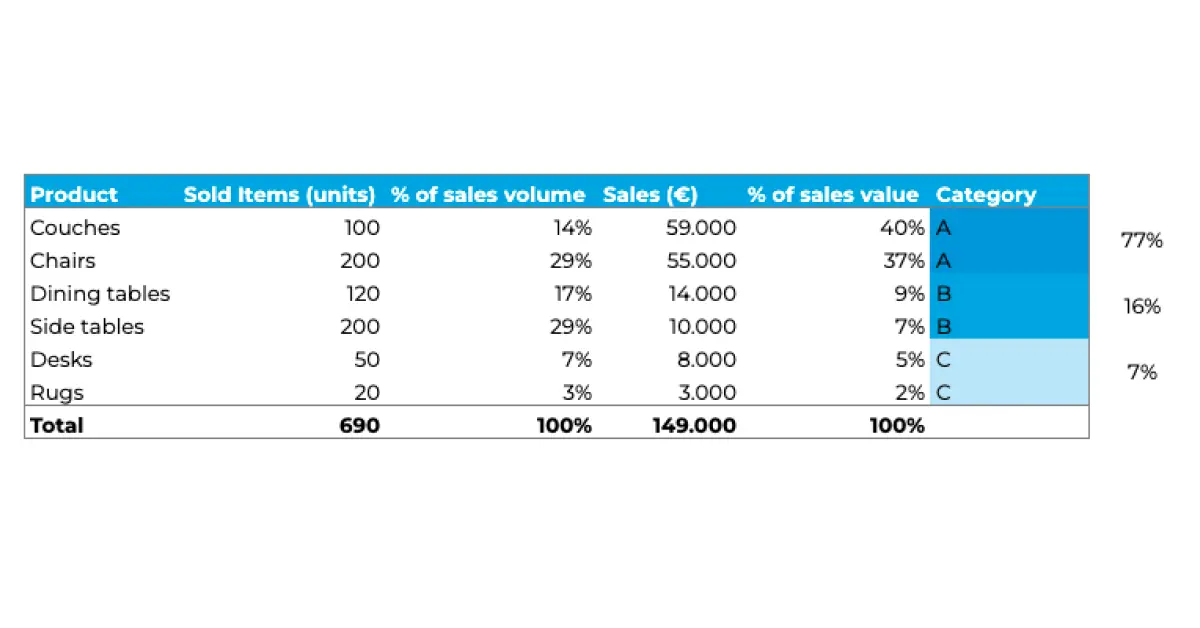
You can already start an ABC-analysis in Excel. Perform the categorisation analysis in five steps with the data from your internal CMS, WMS or ERP system. Below we describe an example analysis for a furniture retailer or wholesaler.
Step 1: Make a list with products you want to analyse and write down the total of sales per product in units. Sum the total of all sold products at the bottom.
Step 2: Then calculate the percentage of sales volume per product.
Step 3: Write down the total sales value per product expressed in euros. This is the unit price multiplied by the total number of sales per product. Sum the total sales value of all products sold at the bottom.
Step 4: Then calculate the percentage of sales value per product.
Step 5: Remember the 80/20 rule and make the classification per category to A, B and C.
How do ABC-analysis and inventory optimisation software work together?
A manual ABC-analysis shows you in a relatively quick way how your stock is structured and what the points of attention are within your stock management.
Limitations of ABC-analysis
The example shows us that an ABC-analysis is a fairly static and one-dimensional method. The analysis does not provide insight when:
- New products are introduced,
- When seasonality plays a part,
- In situations where customer demand does not move linearly.
It can be a time-consuming task if you are constantly updating manual ABC-analyses because of this. Especially if you purchase on instinct, manage a small stock, work with a min-max stock and/or consider all products in your stock equally important - you might question why categorising is useful.
ABC-analysis in inventory optimisation software
The utility of ABC-analysis is taken to a next level by the automation of inventory optimisation software. The AI forecasting model of Optiply analyses data directly from your CMS, WMS or ERP system, so you can directly see which products contribute the most to your revenue.
With this information you can make your inventory management more efficient and keep your stock level balanced. Do not store stock in your warehouse unnecessarily and keep cash flow free for things that can more immediately generate revenue.
ABC-analysis improves supplier management
With purchasing advice that is updated in real time, you can take purchasing decisions that lead to better product availability of your most important products. Furthermore, you get insight into the ‘the value’ of your suppliers.
A supplier of category A products is an important partner and contributes a significant share of the revenue - and success - of your business. This knowledge allows you to improve your supplier management.
Conclusion
The ABC-analysis is a method for you as a purchaser and/or entrepreneur to get insight into what contribution products and suppliers have to your business. It enables you to make your inventory management more efficient, so that you do not store stock unnecessarily.
Cash flow is therefore not lost to inventory costs (either upfront or holding costs). In addition, you can also use an ABC-analysis to find out which suppliers supply the most important products. This information about both stock and suppliers enables you to make more targeted purchasing decisions and to price products accordingly.
While manual ABC-analyses are time consuming, inventory optimisation software provides automated analyses. Optiply’s AI purchasing algorithm provides you with real-time purchasing advice, so that you can balance product availability and stock management.
Veelgestelde vragen beantwoord
Heb je nog vragen over Optiply? We hebben de meest gestelde vragen voor je op een rij gezet.


.webp)

.webp)